
Simple, powerful place-based analytics
A truly intuitive location intelligence platform for turning geospatial data into actionable insights.


Built for Australia's planners and real-world decision makers
Planwisely helps teams move beyond assumptions by turning complex spatial data into clear, defensible insight for real planning and site decisions.
So, what project are you working on?


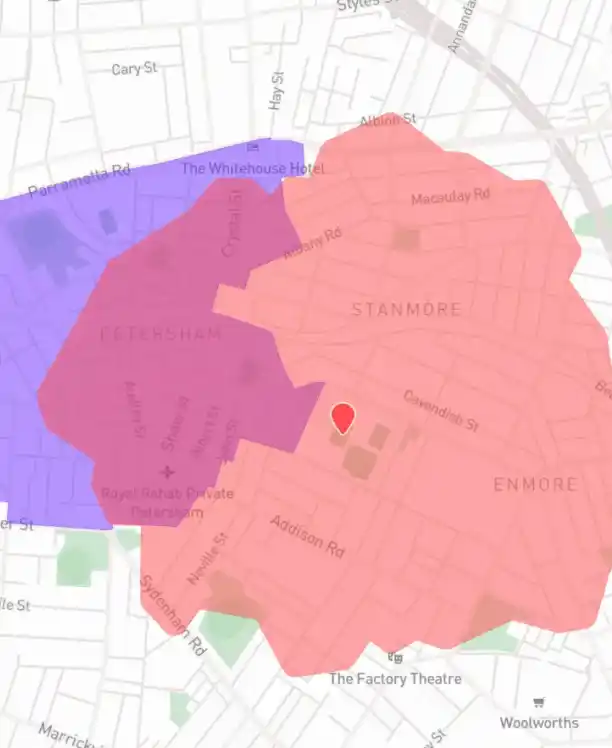
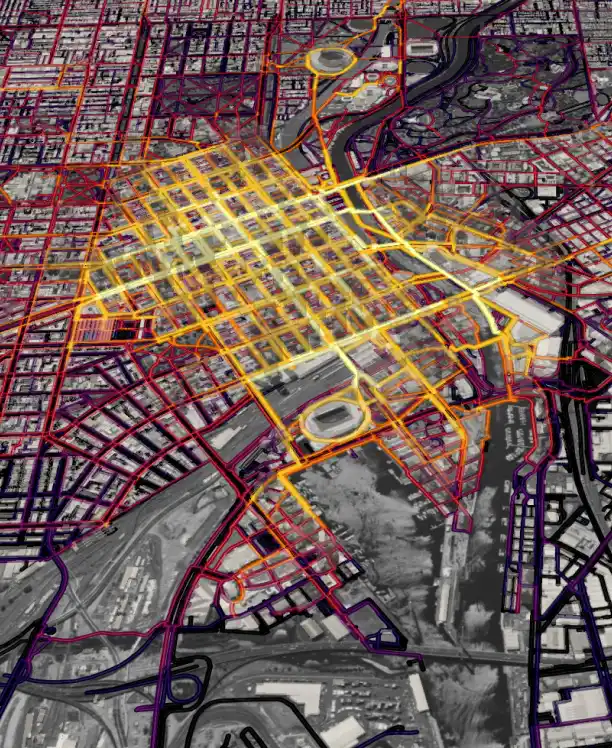
7 unique ways to plan with People Movement Data
Trusted by leading planners and decision makers


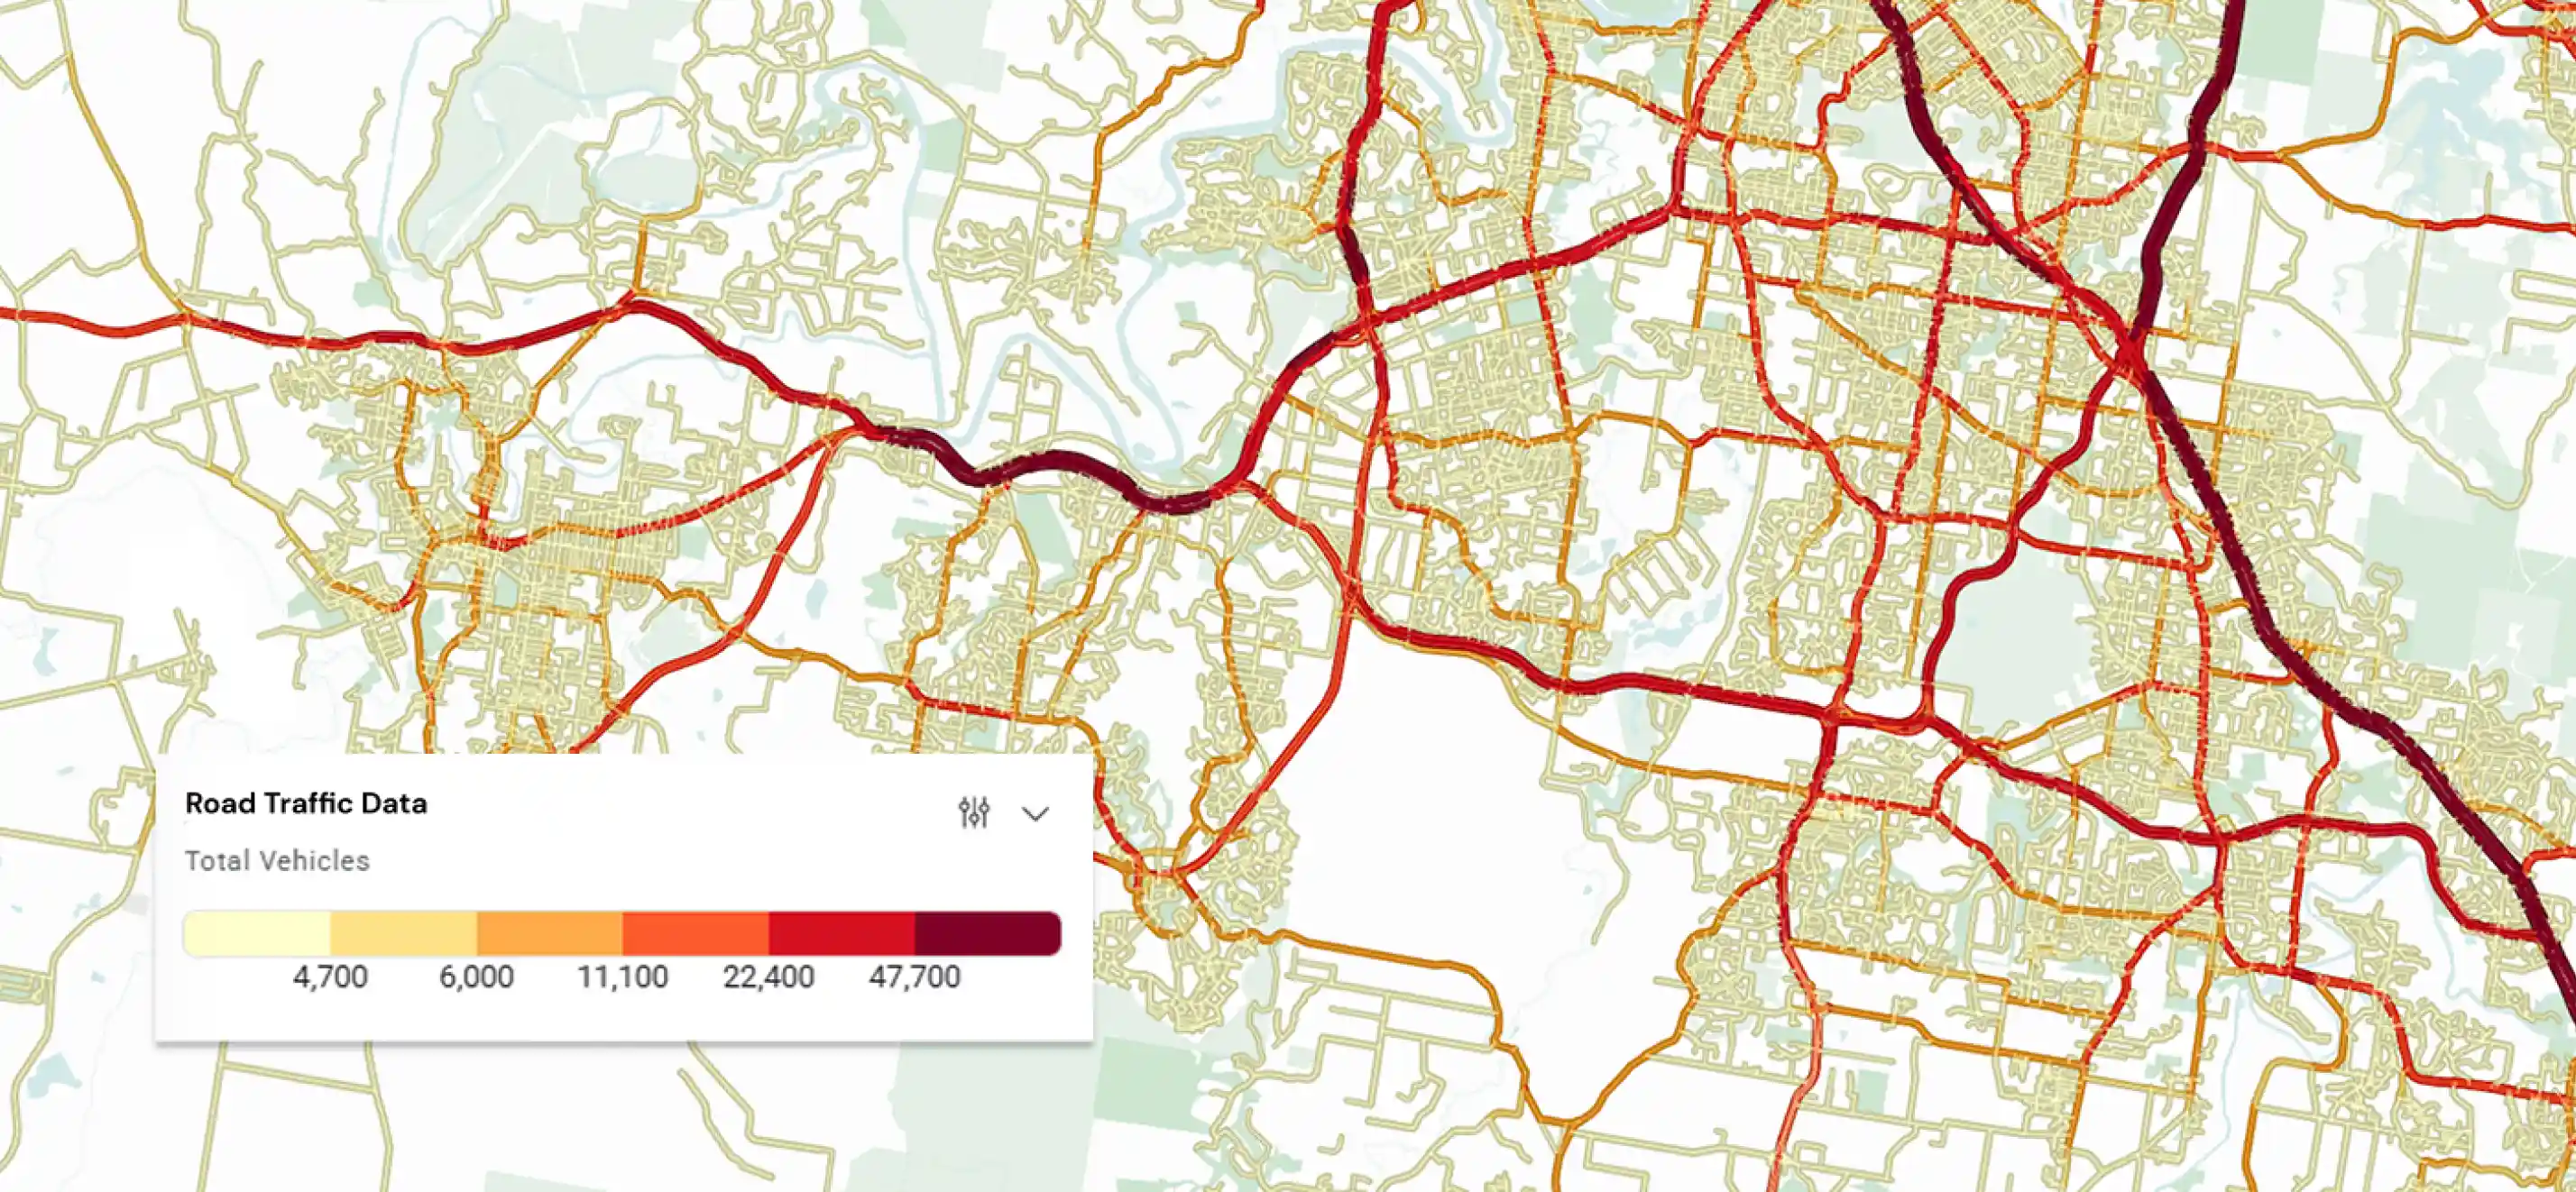
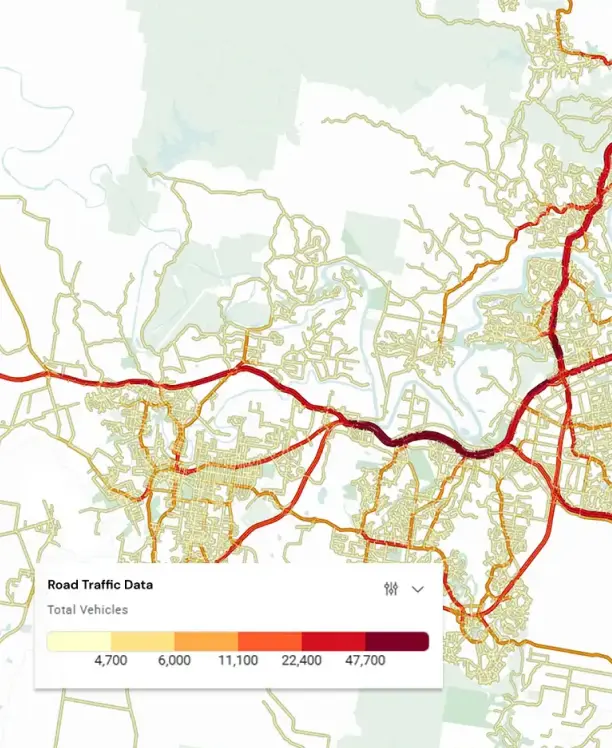
Road Traffic Data in Planwisely
Our latest insights
Article
Article
Planwisely launches Road Traffic Data with nationwide coverage and journey analysis
Article
Planwisely has officially launched Road Traffic Data, a new dataset providing a comprehensive, Australia‑wide view of vehicle movements.
Article
Article
What's new in Planwisely | February 2026
Article
Our latest updates mean Planwisely users get an expanded data library, advanced drawing tool features and more. Find out what’s new.
.jpg)

Want to get started with Planwisely?
Use powerful geospatial datasets to uncover insights, guide your decision-making process and deliver better outcomes for your project today.