Our team are always updating Planwisely’s data library, features and functionality. Here’s the latest on what’s new.
Jobs by Industry/Occupation
The Jobs by Industry/Occupation layer has been updated to the latest ABS data and is now a more advanced layer: supporting multiple geographies, cross-tabulating multiple industries, and viewing proportions/densities for any combination.
Why it’s useful: The Jobs by Industry layer gives Planwisely users a flexible tool for investigating where jobs are located, delivering geocentric insights into employment trends and economic activity. These insights can be used to inform strategic planning, transport planning, site selection, economic development planning, workforce development and a range of land use applications.
The Jobs by Industry layer shows where jobs are located in a granular way (lighter colours depict higher proportions of jobs in that area).
Mode of Travel to Work
This new mode share dataset replaces the previous Journey to Work datasets in Planwisely’s data layer library. This dataset lets Planwisely users explore which modes of travel to work were most popular in 2016 and 2021 using ABS data. The 2021 data, captured in August 2021, shows the rise in work-from-home (WFH) activity because of the COVID-19 pandemic.
Why it’s useful: Understanding how residents commute to work makes it possible to identify patterns, design and implement traffic management strategies and plan transport infrastructure, helping to reduce congestion and create more efficient transport networks. Also, because the data is useful for understanding daytime populations, it can offer evidence-based insights for site selection and property development purposes.
The Mode of Travel to Work layer is a useful tool for understanding travel patterns and daytime populations.
Geographic boundaries update
We've updated Planwisely’s boundaries layers with the most recent data and added new functionality, including better labelling. You can visualise defined boundaries at a range of different units
Why it’s useful: Boundaries help define or orient spatial analysis and are crucial for a range of planning processes, including zoning and land use decisions.
Boundaries create context and can define your area of analysis.
Infrastructure Investment Programs
This powerful data layer allows Planwisely users to explore infrastructure projects that have received funding from the Australian Federal Government. These projects can be filtered and visualised according to a range of parameters and categories, and you can view more details for individual projects by selecting them on the map.
Why it’s useful: A comprehensive view of infrastructure projects and specific details on each of them – combined with other data layers and their subsequent insights – supports effective planning, coordination and management of various planning outcomes that are impacted by infrastructure projects.
You can filter projects by their completion date, project type and more to understand infrastructure investment across Australia.
Search by coordinates
The search tool has been updated to allow location search using a latitude and longitude. Planwisely users can now search for places by region, placename, address or coordinates.
Why it’s useful: Searching for locations using coordinates allows for greater spatial accuracy and a way of navigating to locations that don’t have an address.
Melbourne Development Activity
The 3D Melbourne Development Activity layer has been updated to show development application status as of late 2024 within the city, which can be filtered by status and visualised in 3D according to their footprint and size.
A 3D representation of what's been approved (green), what's been applied for (blue) and what's under construction (yellow).
Canberra Active Transport Planning Datasets
A number of data layers related to active transport have been added to Planwisely, including Canberra Cycling Routes, Car Parks, Community Paths, Land Custodianship, Land Zoning, Local and Main Cycle Routes, Micromobility Operating Area, and Pedestrian Crossings.
Ask us about specific data layers in Planwisely today
The NSW Environmental Planning Instruments land use and planning layers have been updated, including Building Height, Dwelling Density, Flood Planning, Floor Space Ratio, Heritage, Land Reservation Acquisition, Land Zoning, and Lot Size.
Tasmania Open Data Layers
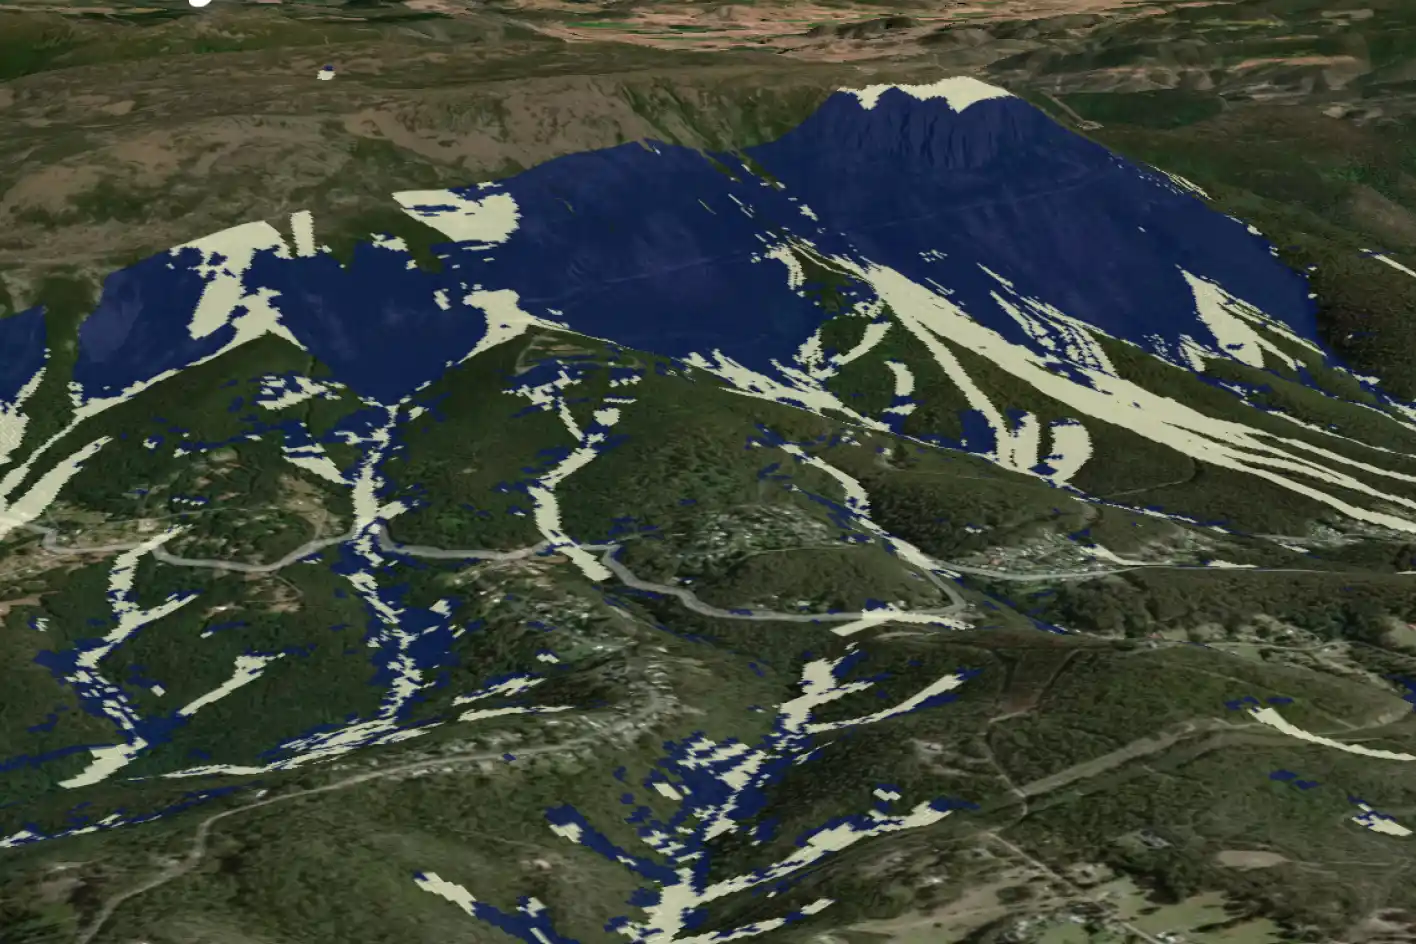
We’ve added open data layers from the City of Hobart, including environmental hazard data layers, as well as state-wide Tasmanian Planning Scheme Zones.
Landslide hazard data visualised in 3D terrain.
Additional data layer updates
In addition to the above updates, we’ve also added a wide range of other spatial data layers, covering everything from environmental hazards to GP locations across Australia:
- Contours (QLD)
- Noosa Land Use and Planning Layers (BBQs, Entertainment Precincts, Park Space, Pathways, and Trees)


.jpg)


